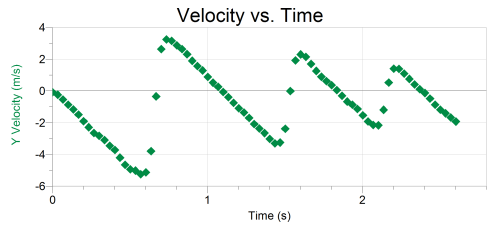
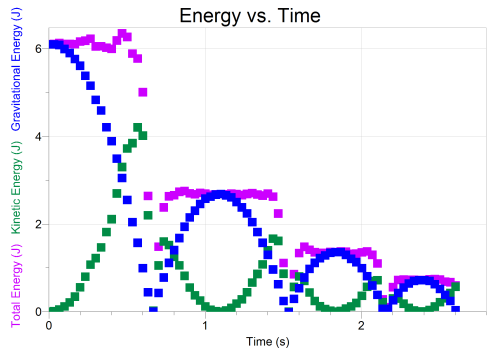
Nothing earth-shattering here. I just wanted to share the activity we worked on today, which was an introduction to quantitative energy conservation by doing a video analysis of a bouncing ball. (Up until now, we were only doing qualitative energy pie charts.) Here are the handouts and the video:
- PreLab: Energy of a Bouncing Ball 2013 (docx)
- Lab: Energy of a Bouncing Ball 2013 (docx)
- Ball Bounce Video (avi) — From Ball State’s Video Analysis: Real World Investigations for Physics and Mathematics
The graphs from the analysis are just beautiful:
Lots to talk about in those graphs!
Feel free to edit and reuse the handouts as you see fit. They’re not perfect, but I figure it’s better to share them than having them collect dust on my flash drive.
PS: I’ll sheepishly admit that I don’t do the whole suite of paradigm labs in the Modeling unit to mathematically derive the energy equations from experiments. But we do some simple qualitative demos/experiments to discover what variables would be in those energy equations. We start by talking about how the further a rubber band is stretched, the more energy it stores. Then we launch carts into a rubber band “bumper” (i.e., big rubber bands from Staples and two C-clamps) to qualitatively see the energy stored.
In doing so, we see that the cart’s kinetic energy depends on its speed and its mass. (Or is it weight? What would happen if we repeated the experiment on the moon?)
For gravitational energy, we can repeat the experiment, but have carts rolling down an incline. Or use the rubber band to launch the cart up the incline. I’ve also dropped balls into sand and looked at the depth to which they get buried. Either way, we see that gravitational energy depends on height and weight. (Or is it simply mass? What would happen on the moon?)
For elastic energy, we already know it depends on the distance the rubber band is stretched. Then, we can swap out the rubber band in the bumper with a stiffer/looser one to see the effects of the spring constant on energy stored.
Then, after we predict what the energy equations might look like, I just give them the actual energy equations, or have them look them up. (Gasp! See Schwartz’s A Time for Telling, aka Preparation for Future Learning.)
So, modelers, what am I missing by not doing the full-blown energy paradigm labs? How do you introduce the quantitative energy equations?


Pingback: Energy Lab Practicals | Total Immersion
I see that Logger Pro has the same poor handling of bouncing balls that Tracker used to have, before I made a velocity and acceleration fit that handled acceleration spikes: see http://gasstationwithoutpumps.wordpress.com/2011/11/08/tracker-video-analysis-tool-fixes/
Hi frank,
I actually do Eg first. . . . They see pretty easily that the area of a force vs. height graph is the energy. That makes hookes law that much easier. Using hoop springs ( from Rex rice) makes the elastic to kinetic lab pretty sweet as well. Do you do any further labs for light, thermal or electrical energy?
Good to see you posting. I hope you come by St. Louis sometime, drag mark back with you!
Jim cibulka
Kirkwood high school
How well does dropping balls into sand work? We’re looking to change our GPE lab from carts, masses, and pulleys to something conceptually simpler. What do you do to stop the sand from packing together and becoming too sturdy for the balls to penetrate?
My favorite part of the energy graph is the fact that the total energy jumps to zero while the ball is bouncing. This is because energy is stored at that snapshot essentially as elastic interaction energy. Thus energy left the system, then entered back into the system, in each bounce.
As far as what you are losing by not doing the full paradigms….on one hand it takes a long time. On the other, I really like that students get real experience doing real science, actually taking and analyzing data. I think your version gets the ideas across enough, and maybe that’s the point of the paradigms…but I like the quantitative piece as well. This sets them up well to design their own labs; http://rutherford180.wordpress.com/2013/03/11/day-111-student-energy-lab-designs/
Go to day 112 for some results, which were pretty great overall.
PS: Regarding how I start Energy, I was very pleased this year by using change in energy via work defined by the integral under the Force vs position graph, and measured in LoggerPro, as the basis for the paradigm labs. http://learningandphysics.wordpress.com/2013/02/20/an-empirical-start-to-the-energy-transfer-model-part-1/
Sorry to be a ‘look at my blog!” commenter…but apparently not sorry enough to not do it. 🙂
Pingback: Links- March 2013 | SPACS
Would kinetic and Gravitational energy both depend on mass? I am not great at science but that’s what I can remember from science class.
Hi Brody,
Great question! You’re right — both kinetic energy and gravitational potential energy depend on mass. This would affect the numbers on the vertical scale of the energy graph. For example, a ball with twice the mass would have twice the gravitational energy at the start. However, the shapes of the energy graphs would remain the same.
Pingback: Links- March 2013 | Logic+
Hi Frank,
I’ve been doing that exact same bouncing ball experiment since I started teaching (four years ago). The results are indeed beautiful. One thing I noticed this year is that some students, when discussing their results, feel very compelled to mention air resistance, even saying that it’s the main source of energy loss. I discovered it’s really quite hard to convince them that air resistance in this case is completely negligible and that it can be seen from their own data. It’s a really great activity that gets you a view inside your students heads.
This year my whole energy program (for 15/16 year old high school students) was focussed around the bouncing ball. We had the kinematics part behind us, so to start up energy I gave them some whiteboard questions. Find the maximum altitude of a ball launched from the ground with 10 m/s (using kinematics). Try to discover an equation that gives the altitude for any speed. When we have this, I take their results and label two colums: one ‘gh’ and the other ‘1/2 v^2’. We discover that for the entire ball’s flight, the total of these two quantities is conserved. Now if every thing in the world had the same mass as the ball, we’d be done. But a bowling ball dropped from 1m does do a lot more damage to your toes than a tennis ball. This gets us into the importance of mass. The derivation is not at all rigid, but I found that most of my students grasped the message and the importance of it. What’s more, they have essentially derived it themselves and it really sticks. I really sensed an air amazement and achievement among my students when we did this.
Frank, you’ll be happy to know that the gentleman dropping the ball in the video is a physics professor at Ball State University who used to be at Texas A and M (when he made all of those videos). His name is Joel Bryan and he is a fantastic presenter. I met him at an Indiana AAPT meeting and have subsequently had the good fortune to hear him present on various teaching physics related topics. He might also be in the officer rotation for INAAPT. One of the things I miss most about moving away from Indiana is not being able to participate in INAAPT gatherings.
Pingback: Modeling in AP Physics C Mechanics – Paradigms | fysicsfool