#AAPTSM18 Recap #1 – “Can We Have a Group Test?”

Saturday July 28

“Can We Have a Group Test?” Designing Collaborative, Active, Alternative Assessments for Physics Classes (Kelly O’Shea, Danny Doucette)

On Saturday, I attended Kelly O’Shea’s and Danny Doucette’s all-day workshop on lab practicums. All of their slides and handouts are here: AAPT Collaborative Group Practicum Exams Workshop.

For the first half of the day, Kelly and Danny had us in “student mode” as we performed several of the practicums in groups and then shared our experiences with the rest of the participants.

There were two rounds of practicums. Round 1 had practicums on friction, kinematics, and energy.  Round 2 had practicums on calorimetry, internal resistance, two-slit diffraction, and rolling projectiles.

After lunch was dedicated “work time” where we had time to work on developing new practicums of our own, either alone or with others. One group of participants, led by Val Monticue, developed a generalized grading rubric for practicums. I worked on two things: (1) designing a new practicum with several other teachers that ties together energy, momentum, and friction; (2) designing “leveled practicums” with Jenn Broekman.

The set-up for the new practicum is an adjustable pendulum with a 100-gram bob that swings down and strikes a 100-gram tissue box (mostly empty), which causes the tissue box to slide across the table. The practicum has 2 parts: (1) Vary the release height of the pendulum so that the pendulum comes to rest upon impact with the tissue box. (2) Using the data from the first part, predict the necessary release point of the pendulum so that the tissue box slides a given distance (preferably so the the box reaches the edge of the table, but does not slide off).

IMG_20180728_162013561.jpg

A lot of time was spent figuring out what size/mass the pendulum and box had to be so that the box slid a decent distance when struck by the pendulum. At first, we tried a small block several centimeters thick. The block had tendency to spin when struck, and sometimes the pendulum swung over the block. Then we tried a larger wood block. While it was tall enough that the pendulum didn’t swing over the block after impact, it didn’t slide very far due to its increased mass. Finally, we discovered that a tissue box worked really well — tall and light. Coincidentally, the mass of the mostly empty tissue box and the pendulum bob were the same (100 grams).

Once we got the set-up working, we put the practicum to the test to see if it would actually work. First we found the “sweet spot” when the pendulum comes to rest after striking the tissue box. Based on the release height of the pendulum and the distance the tissue box slides after impact, would could calculate (1) the speed of the pendulum right before hitting the box; (2) the speed of the box immediately after being hit; (3) the coefficient of friction between the box and the table; (4) the percentage of kinetic energy lost in the collision. Assuming the percentage of kinetic energy lost is the same in all collisions between the pendulum and the box, we calculated the pendulum release height needed for the box to slide 1 meter. Our predicted height (~40 cm, if I recall correctly), was much larger than the actual height needed (~80 cm). So while it didn’t work, we think that the practicum was still fun and challenging and tied together lots of different topics. Having students reflect on their assumptions and explain why the actual height is larger than the predicted height would be good, too.

For the remainder of the work time, Jenn Broekman and I turned the traditional constant velocity lab practicum into a “leveled” practicum. We got the idea from Kelly O’Shea that day, who suggested redesigning practicums so that all students could feel successful. Jenn and I broke the buggy practicum into 3 levels (easier, regular, more challenging). Here’s what we came up with:

IMG_20180728_161847381.jpg

IMG_20180728_161843646.jpg

We think these could be deployed in several ways. One option is for all students to start with Level 1 and work through as many as they can in the time allotted. Hopefully by the end of class, all groups will have completed at least the Level 1 task. One drawback to this deployment is that it’s possible that some groups that would be successful with Level 3 would never get a chance to try it because they spent most of class time working on Levels 1 and 2.  So another deployment possibility is for students to chose the level of task they feel most comfortable with first. In this case, a group could start with Level 3 and spend all class period working on it and be successful in the end, while another group might need all period for Level 1, and another group might start with Level 1 and then move on to Level 2.

After work time, everyone shared what they worked on. Here’s a practicum developed by another group. It’s about electromagnetic induction:

IMG_20180728_162430804.jpg

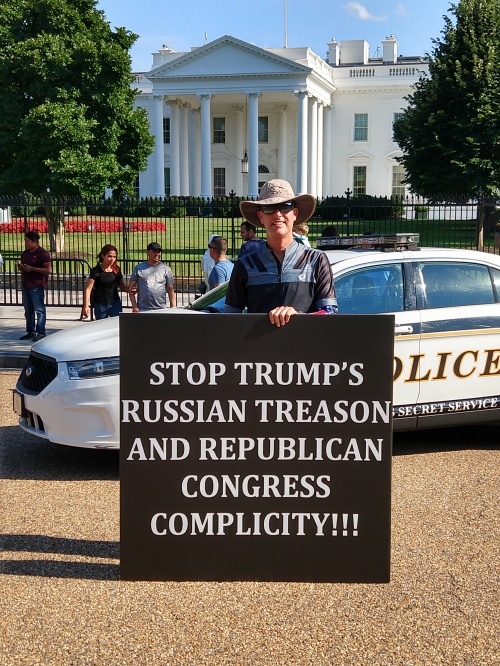
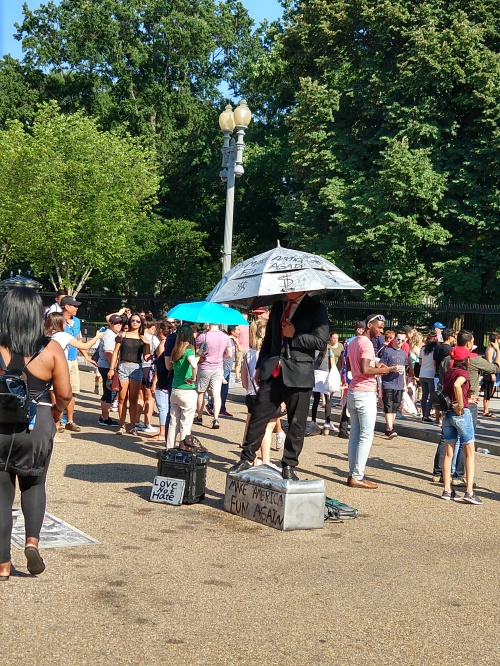
After the workshop, I walked back to my hotel, which took me past the White House. There were several protesters there, and a person dancing and wearing a Trump mask.

IMG_20180728_170645828_HDR.jpg

IMG_20180728_170616299_HDR.jpg

IMG_20180728_170700038_HDR.jpg

More updates about the rest of the conference in future posts!

Gallery

Day 65: Hour of Physics Code

This gallery contains 4 photos.

Originally posted on Noschese 180:
College-Prep Physics: I’ve been coding with my AP Physics classes for years. But in honor of this week’s Hour of Code, I tried VPython programming for the first time with my College-Prep class. We used the GlowScript version…

Day 26: What Causes Gravity?

Readers of Action-Reaction may be interested in this recent post on my 180 blog.

Noschese 180

College-Prep Physics: Even though we now have a mathematical relationship between mass and weight, we still don’t know what causes Earth’s gravitational pull. So first, we took a short survey:
GravitySurvey
Download a copy here: GRAVITY Survey 2015

Then we went through each of the four claims in survey question 4 and did a testing experiment for each claim.

CLAIM #1: Earth’s Magnetism

wpid-img_20141010_110307328.jpg

CLAIM #2: Earth ‘s Rotation

wpid-img_20141010_110052269.jpg

CLAIM #3: Air Pressure

wpid-img_20141010_105913849.jpg

CLAIM #4: Earth’s Mass

We also compared characteristics of different planets using a table of planetary data.

This sequence of claims and questioning is based off one found in Preconceptions in Mechanics. On Tuesday, we’ll discuss the relative strengths of the gravitational pulls that 2 masses exert on each other.

##BFPM

NGSS Science and Engineering Practice #6. Constructing Explanations 

View original post

Day 16: Relative Motion

Readers of Action-Reaction might be interested in today’s post from my 180 blog.

Noschese 180

IMG_20140924_104509957_HDR

College-Prep Physics: This year I decided to bring relative motion into my curriculum. It’s a unit in Preconceptions in Mechanics, a book I used a lot last year for introducing different types of forces. My hope is that vector addition of velocities (which can be easily demonstrated, see below) will help some kids understand that vector addition of forces act the same way.

I modified the lesson cycle from the Preconceptions in Mechanics, Unit 2Day 1 Lesson.

I started off the lesson showing the first 15 seconds of of this Japanese video in which a baseball is shot at 100 km/hr out of the back of a truck moving in the opposite direction at 100 km/hr (you could even do the first 3 minutes if you’re evil):

They’re hooked. “What happens?”

Next, I handed out the voting sheets. Here are the slides with my questions for each stage of…

View original post 388 more words

Day 13: A New Approach to Colliding Buggies

Today’s 180 blog post that Action-Reaction readers might be interested in….

Noschese 180

College-Prep Physics: Modeling Instruction’s standard lab practicum for the constant velocity unit is colliding buggies. Lab groups take data to determine the speed of their buggy, then the buggies are quarantined and groups are paired up. Each group pair is then given an initial separation distance for their buggies and are asked to predict the point were the buggies will collide. Once they calculate the answer, they are given their buggies back to test their prediction.

It’s fun, but there are some frustrations. Groups that have poor experimental design or data collection techniques won’t calculate the correct buggy speed, which means they won’t accurately predict the collision point. Also, since only the separation distance is given, there isn’t much focus on the position of the buggy and students are less likely to use a graphical method to find the collision point. They try all sorts of equations instead. In the end, one person in…

View original post 393 more words

Flappy Bird Physics Is Real Life?

If you don’t already know, Flappy Bird is the hot new mobile game right now. The premise is simple: navigate the bird through the gaps between the green pipes. Tapping the screen gives a slight upward impulse to the bird. Stop tapping and the bird plummets to the ground. Timing and reflexes are the key to Flappy Bird success.

This game is HARD. It took me at least 10 minutes before I even made it past the first pair of pipes. And it’s not just me who finds the game difficult. Other folks have taken to Twitter to complain about Flappy Bird. They say the game is so difficult, that the physics must be WRONG.

https://twitter.com/NurulAkiller/status/428892206754037760

https://twitter.com/MadsEltonNilsen/status/428794101899616256

https://twitter.com/ThatPuckBeaut/status/428781313433149440

https://twitter.com/garyscott_/status/428763347794665472

https://twitter.com/La_Tayy/status/428689724425785344

https://twitter.com/Bella_Bonita_/status/428680939326017536

https://twitter.com/maaddawwg/status/427833802140815361

https://twitter.com/184bader/status/428541838283116544

https://twitter.com/ImChase_WutIDK/status/428532979192049664

https://twitter.com/veeedoh/status/428419628600410112


So, is the physics unrealistic in Flappy Bird?

Sounds like a job for Logger Pro video analysis! I used my phone to take a video of Flappy Bird on my iPad. To keep the phone steady, I placed it on top of a ring stand with the iPad underneath.

IMG_20140130_141424614

(I’ve uploaded several of the videos here if you’d like to use them yourself or with students: Flappy Bird Videos.)

Then I imported the videos into Logger Pro and did a typical video analysis by tracking Flappy’s vertical position in the video. Sure enough, the upside-down parabolic curves indicate Flappy is undergoing downward acceleration.

FlappyBirdPosition

But do the numerical values represent normal Earth-like gravity or insanely hard Jupiter gravity? In order to do this, we need to (1) set a scale in the video so that Logger Pro knows how big each pixel is in real life and (2) determine the slope of Flappy’s velocity-time graph while in free fall, which is equal to the gravitational acceleration.

The only thing we could realistically assume is the size of Flappy Bird. If we assume he’s as long as a robin (24 cm), then the slope of the velocity-time graph is 9.75 m/s/s, which is really close to Earth’s gravitational acceleration of 9.8 m/s/s. Flappy Bird is REAL LIFE.

FlappyBirdAcceleration

So then why is everyone complaining that the game is unrealistic when, in fact, it is very realistic? I blame Angry Birds and lots of other video games. Repeating the same video analysis on Angry Birds and assuming the red bird is the size of a robin (24 cm), we get a gravitational acceleration of 2.5 m/s/s, which only 25% of Earth’s gravitational pull.

AngryBirdsRobin

In order to make Angry Birds more fun to play, the programmers had to make the physics less realistic. People have gotten  used to it, and when a game like Flappy Bird comes along with realistic physics, people exclaim that it must be wrong. As one of my students notes:


UPDATE 31 Jan 2014:
Inspired by a tweet from John Burk,

we made a video showing Flappy Bird falling at the same rate as a basketball:

Here’s what I did: We determined from the analysis above that Flappy Bird is about 24 cm across. Conveniently, basketballs are also about 24 cm across. So I had my physics teacher colleague Dan Longhurst drop a basketball so I could video it with my iPad. Dan just needed to be the right distance away from the camera so that the size of the basketball on the iPad screen was the same size as Flappy Bird on the screen (1.5 cm). Next, I played the basketball drop video and Flappy Bird on side-by-side iPads and recorded that with my phone’s camera. Once I got the timing right, I uploaded the video to YouTube, trimmed it, made a slow motion version in YouTube editor, then stitched the real-time and slow motion videos together to create the final video you see above.

UPDATE 1 Feb 2014: While the gravitational acceleration in Flappy Bird is realistic, the impulse provided by the taps are NOT realistic. Here’s a velocity-time graph showing many taps. When a tap happens, the velocity graph rises upward:

FlappyBirdConstantPostTapVelocity

As you can see, no matter what the pre-tap velocity (the velocity right before the graph rises up), the post-tap velocity is always the same (a bit more than 2 m/s on this scale). This means that the impulses are not constant. In real life, the taps should produce equal impulses, which means that we would see that the differences between pre- and post-tap velocities are constant.

TL;DR: Is the physics in Flappy Bird realistic? Yes AND no.
YES: The gravitational pull is constant, producing a constant downward acceleration of 9.8 m/s/s (if we scale the bird to the size of a robin).
NO: The impulse provided by each tap is variable in order to produce the same post-tap velocity. In real life, the impulse from each tap would be constant and produce the same change in velocity.

UPDATE 1 Feb 2014 (2): Fellow physics teacher Jared Keester did his own independent analysis and shares his findings in this video:


What Happened When I Gave Them the Answers

Reblogging today’s 180 blog post to Action-Reaction in order to try to get more feedback from folks. Click through to read more and leave comments over there. Thanks!

Noschese 180

[TL;DR – Not as much as I had hoped.]

College-Prep Physics: Students came to class with the following question completed for homework:

You are on a sleigh ride in Central Park one brisk winter evening. The mass of the sleigh with everyone in it is 250 kg, and the horses are pulling the sled with a combined horizontal force of 500 N. The sled moves at a constant speed of 3.33 m/s.
(a) What is the force of kinetic friction on the sleigh?
(b) What is the coefficient of kinetic friction between the sleigh and the ground?

I asked everyone to whiteboard their answers. I heard some students say they didn’t get it. Several other students came up to me — worksheet in hand — to ask if their answer was right.

“I’m going to give you the answers,” I said. “Here they are.”

IMG_20131119_181312

“Now on your whiteboards, I want…

View original post 536 more words

Quizzes vs. Projects (Mass & Weight Edition)

Tests are evil, let them do projects.

That type of rhetoric frequently appears in my Twitter stream. My gut reaction is hell yeah. But some recent quiz results have gotten me thinking ….

Take for example, this learning objective:
The student understands the difference between mass and weight.

Here’s a student project (not mine) which clearly addresses the objective.

Here’s another project (also not mine). This one is very creative and totally adorable.

But those two projects are really just rehashes of the traditional explanation of the difference between mass and weight: “mass is the amount of stuff an object has and doesn’t change, while weight is the gravitational pull on an object and can change depending on location.” I wonder what would happen if those two students encountered quiz questions like the ones below. Would they make the same mistakes as several of my students did? I feel that even though my students can parrot back the difference between mass and weight (like in the above videos), they don’t really understand that difference if they miss these type of quiz questions:

New Doc 32_2

New Doc 32_3

New Doc 32_4

I did find one project where a student (again, not mine) gives a thorough explanation and uses several examples. I predict that this student should be able to answer those quiz questions.

What I’m trying to say is that I feel that teacher-generated questions and experiences (quizzes, labs, whiteboard problems, etc.) are important because they challenge students to think and apply in ways they probably wouldn’t if we just left them to their own devices.

But I also get that projects let students be creative and allow them to demonstrate their understanding in ways that quizzes simply can’t.

Perhaps the answer is just “all things in moderation.” Or perhaps the project parameters need improvement so students aren’t simply reciting Wikipedia definitions from a Powerpoint? Or something else?

What are your thoughts?

Edtech PR Tips

I’m not a PR guy. I’m just a teacher. But they say that if you want to be a disruptor, the best experience is no experience. So here goes…

1. It’s not about the technology. It’s about what students are empowered to do because of your technology. Show us how you take students beyond what they could do previously. Show student work (“Hey, look what this kid can do!”). Stop focusing on checkmarks, badges, data, dashboards, and slick UI.


2. Learning is social. Show students interacting with each other, questioning, helping, constructing — all as a result of using your technology. Don’t show kids glued to screens, headphones on, working en masse and in isolation. It’s creepy.

rocketship-charter-schools

The Learning Lab at a Rocketship school, where students spend 2 hours each day.

3. Don’t use phrases that signal you have simplistic views about teaching and learning. In particular: Learning stylesdigital nativesindividualized instruction, and content delivery.


4. Practices are equally as important as content. Show how you enable students to engage and grow in the core practices in math, science, and ELA.

PracticesVennDiagram

Credit: Tina Cheuk, tcheuk@stanford.edu [PDF (scroll to bottom)]

5. Show how you implement/compliment research-based practices about how students learn. Study up on these characteristics of effective teaching methods. Otherwise…


6. Run controlled, peer-reviewed experiments that use conceptual diagnostic tests to measure growth. We know most anything works better than (or as well as) passive lecture instruction. But how does implementation of your technology stack up to other evidence-based teaching methods? And be sure to use conceptual diagnostic tests, not final exams or standardized tests or failure rates. CDTs have been painstakingly researched and designed to measure true conceptual understanding rather than algorithm memorization. Without strong evidence, we’re just skeptical of your claims.

hake1

Hake’s analysis of 62 different physics courses as determined by gain on a physics conceptual diagnostic test.

7. Don’t contradict yourself. Your words should match your actions.


8. Show feedback and testimonials from students. In particular, have students demonstrate their deeper understanding and expert thinking that has been enhanced by using your product. Or perhaps your technology has decreased student anxiety and contributed to a positive classroom climate. However, don’t have students talk about shallow things such as raising grades and doing well on tests.

MyEconLab

Testimonials from Pearson/Knewton’s MyEconLab

9. There’s nothing revolutionary about old wine in new bottles. A digital textbook is still a textbook. A video lecture is still a lecture.


10. Read everything Audrey Watters writes. Everything.

Do you have any more edtech PR tips to share? Any more examples of bad PR? Any good examples? Thanks!

Convincing Reluctant Teachers

This question was posted to Twitter today:

Question: how do you convince teachers who are ADAMANT that they teach to the rigor required by CCSS that they really don’t?

(CCSS means Common Core State Standards)

This is a great question. I think it applies to a wide range of situations. You can replace “CCSS” with the Next Generation Science Standards, the new AP Physics 1 and 2 course, or any curricula du jour. It all boils down to showing these teachers that traditional teaching methods do not lead students to a deeper understanding of the concepts.

Some folks may suggest showing the reluctant teachers sample test questions from the new assessments. I say stay far away from that. These teachers will likely look for tricks to game the assessments so students can be successful without the in-depth understanding these teachers think they are teaching.

My suggestion is to have the reluctant teachers administer a basic conceptual diagnostic test to their students. The questions are so basic, so easy, the teachers will say “Of course my students can ace this!”

And then wait for the results to come in.

In all likelihood, the students (on average) will do poorly. Amazingly poorly. Even worse than if they had simply guessed randomly.

To which the reluctant teacher responds, “What happened? They should have known all this!”

Now’s your chance. I think now they’ll be more receptive to what you have to say about how students learn math and science and why interactive engagement techniques work.

***

Here’s Erik Mazur (Harvard physics professor) explaining what happened when he gave his students a conceptual diagnostic test:

(The video is an excerpt from Mazur’s longer “Confessions of a Converted Lecturer” talk.)

***

Extensive lists of concept inventories can be found at FLAG and NC State. Remember, many of these tests have been painstakingly developed and refined by researchers. Be sure to abide by the developers’ rules with administering the tests to students. You should not post them to the internet or discuss the answers with students.